Military
About three-quarters of the 1.4 million active duty military members are eligible to vote absentee with special protections because they're stationed away from their voting residence. FVAP compiles data on military voting from administrative records of absentee ballot requests and vote histories, as well from the Post-Election Voting Surveys of Active Duty Military (PEVS-ADM), State Election Officials (PEVS-SEO), and Voting Assistance Officers (PEVS-VAO).
Among active duty military members, election interest and voting rates tend to be lower during midterm election years and higher during presidential election years.
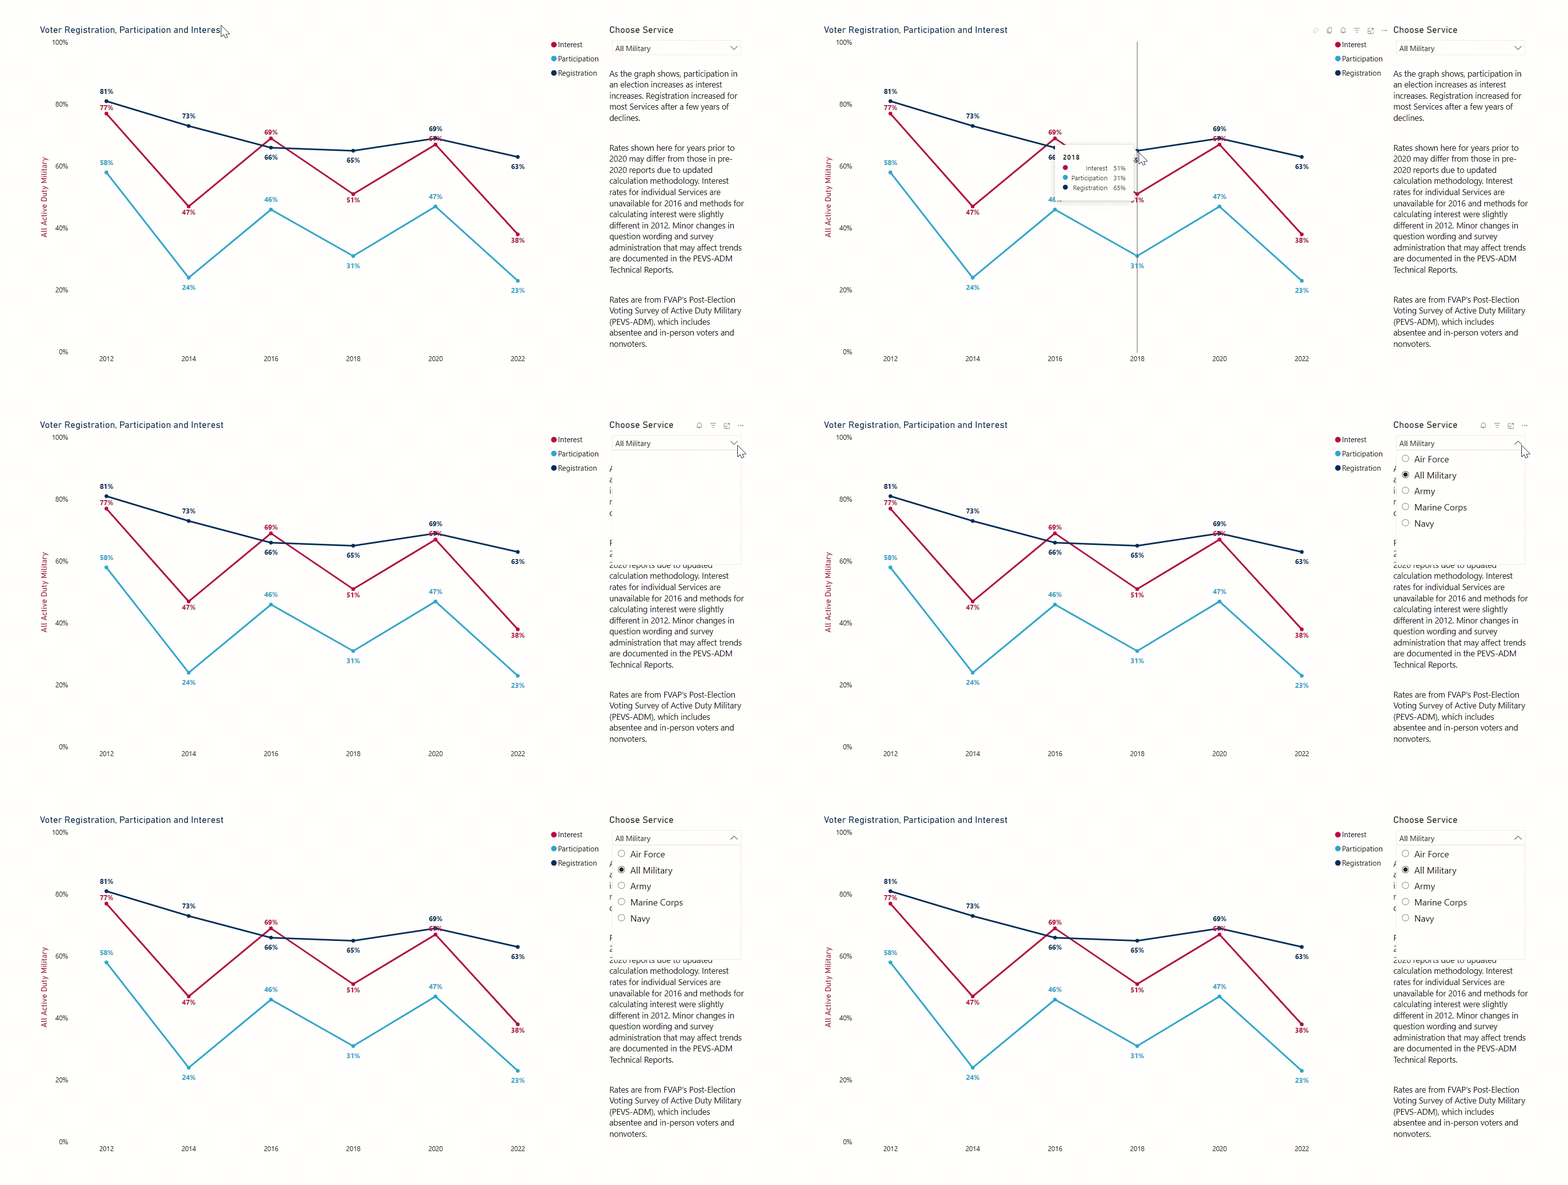
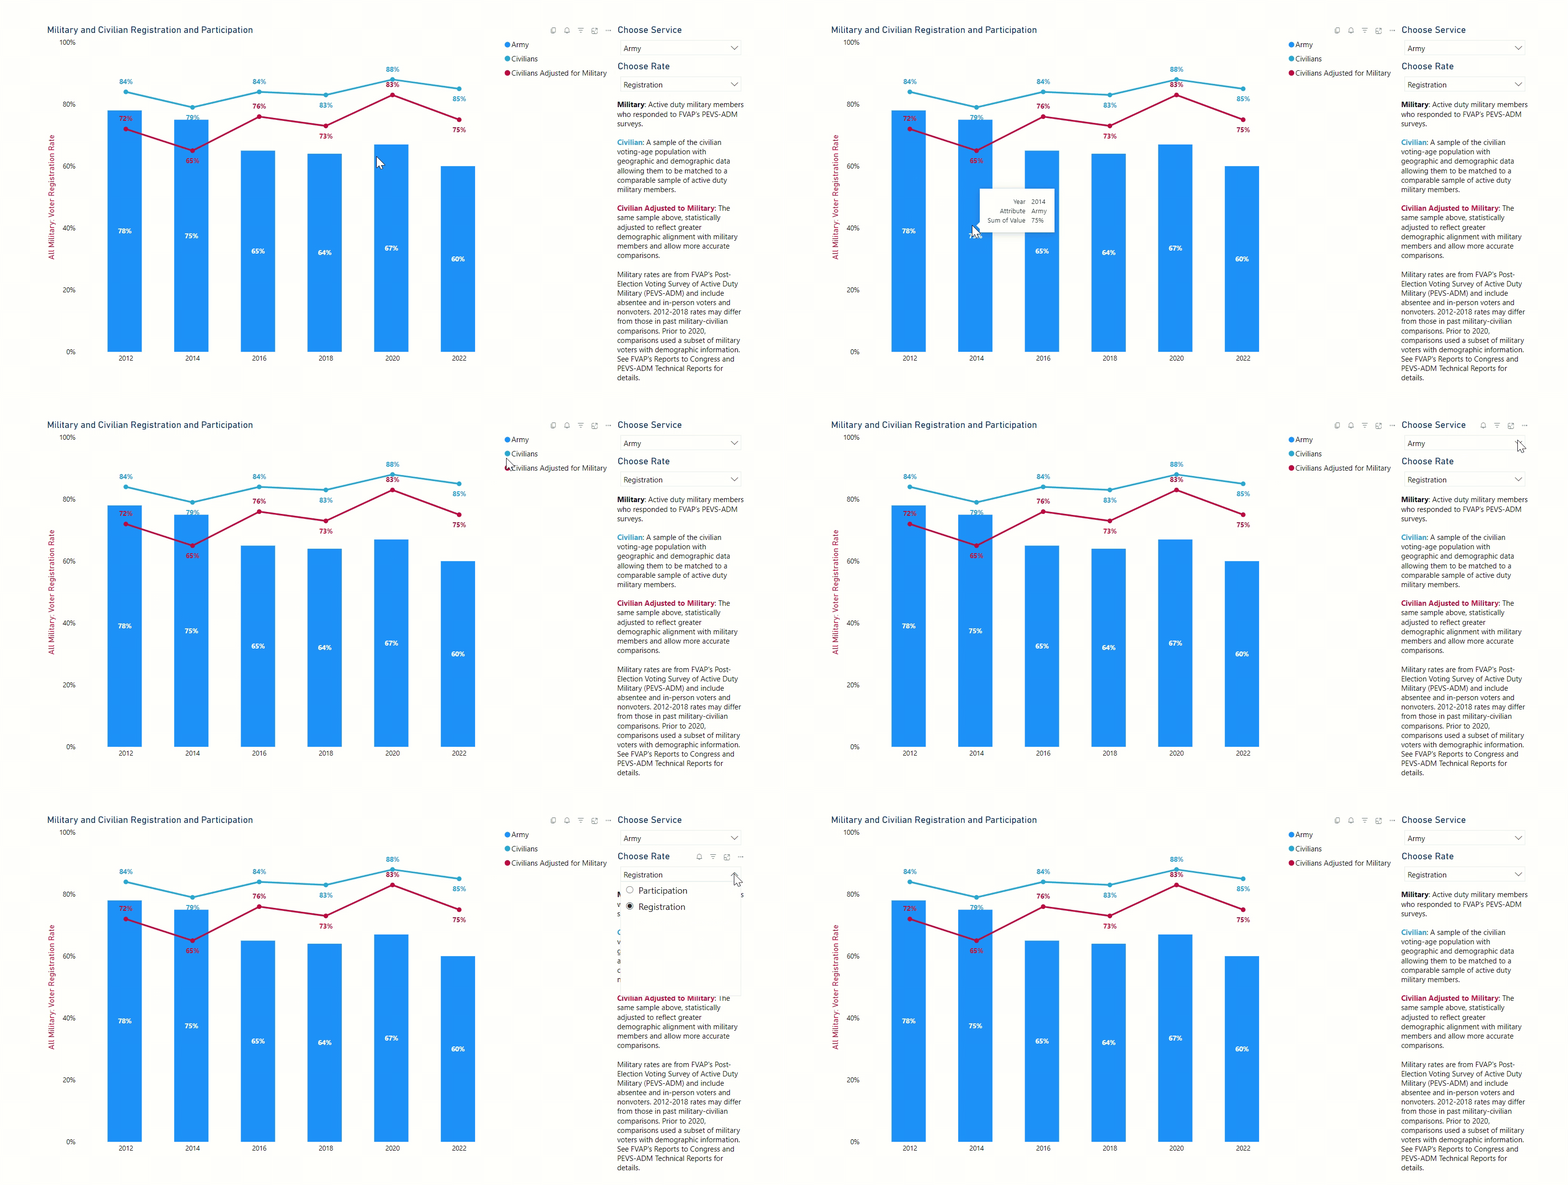
Comparing the Military and Civilian Populations
It is difficult to compare the voter registration and participation rates of U.S. military and civilians as their demographic composition differs in many ways, including age, sex, education, and mobility. FVAP controls for these demographics by comparing registration and participation rates among military members with civilians who most closely resemble the military population.
FVAP differentiates between the military and civilian populations in two ways:
- Comparing a sample of military voters to a sample of the civilian voting-age population (CVAP) with demographic and
geographic data. The CVAP is employed native and naturalized U.S. citizens who are 18 years of age or older and living in
the U.S. — the U.S. Census Bureau's standard measure for voting statistics. - Adjusting the CVAP sample with a statistical model so it more closely aligns with the demographics of the military sample
for a more accurate comparison of military and civilian voting participation rates.
Compared to the civilian population, a lower percentage of active duty military have voted in recent federal elections. FVAP uses military members' responses to survey questions to divide this voting gap into an obstacles gap and a residual gap. Obstacles are factors that impede the speed at which voters receive and transmit election materials — voter registration forms, ballot requests, and ballots themselves.
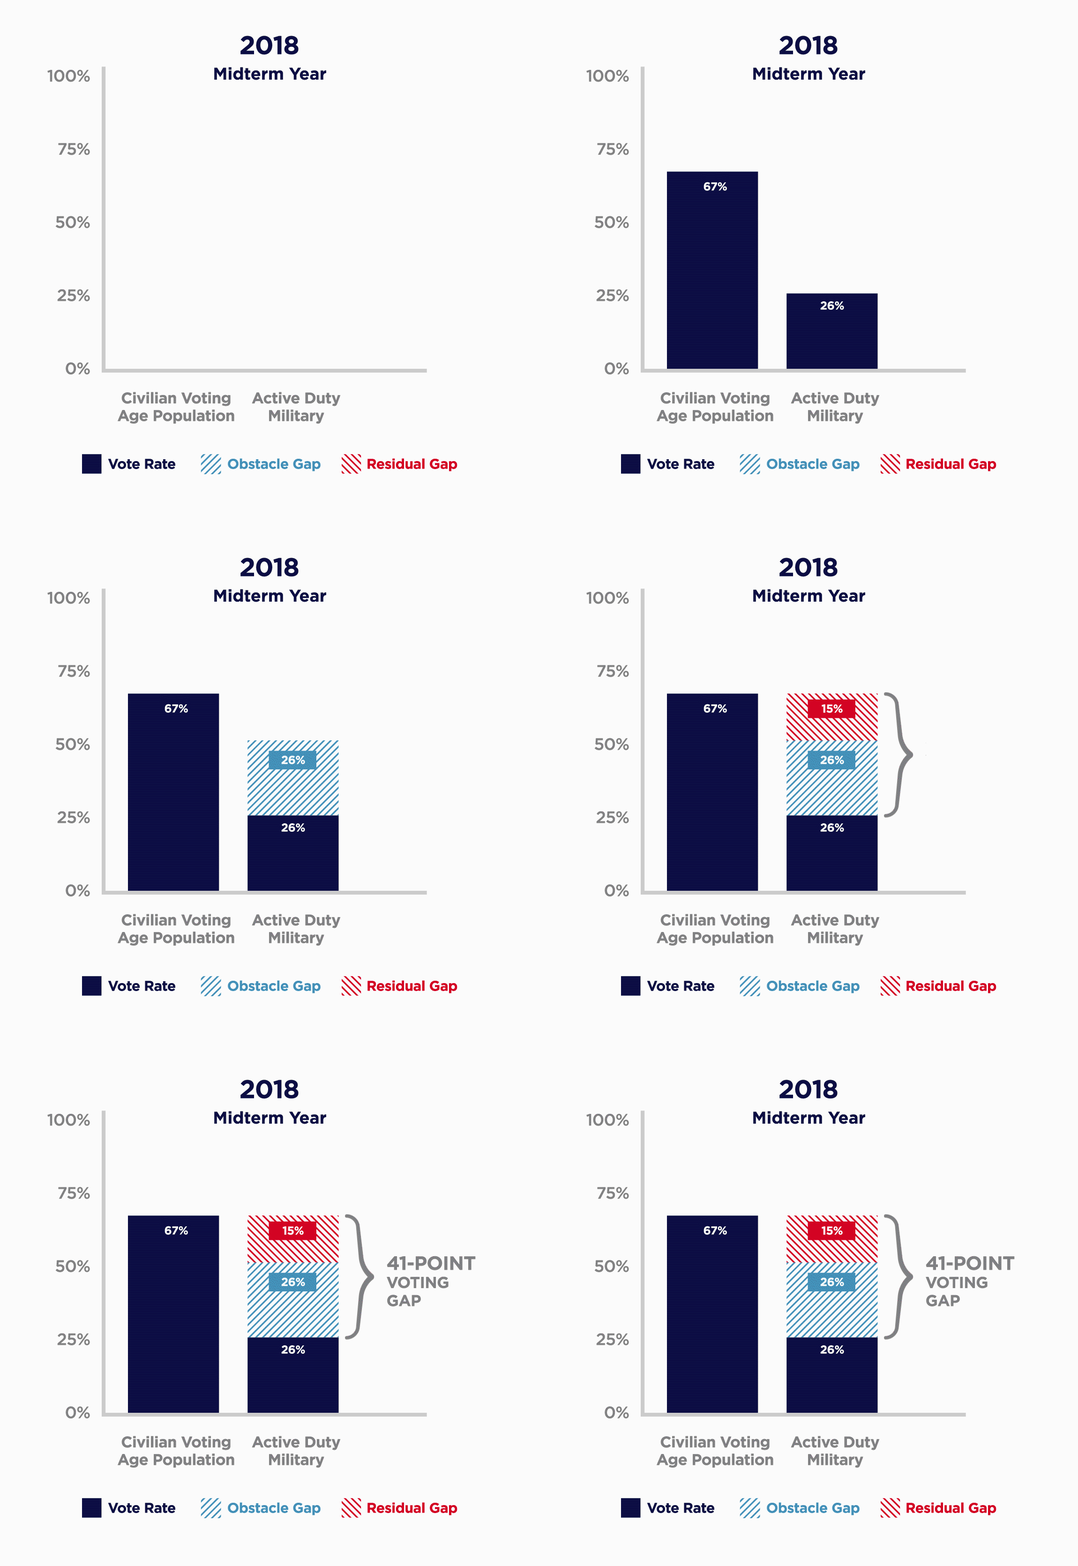
- Vote Rate: The percentage of the voting age population that submitted a ballot and had a vote recorded in state vote history
records. - Obstacles Gap: The percentage of overseas citizens who wanted or tried to vote but were unsuccessful. They may have been
helped by voter education, state legislative changes, or improved communication with election offices. - Residual Gap: The percentage of overseas citizens who did not vote because of factors that cannot be resolved within the voting process, such as lack of interest or motivation.
Characteristics of Military Voters
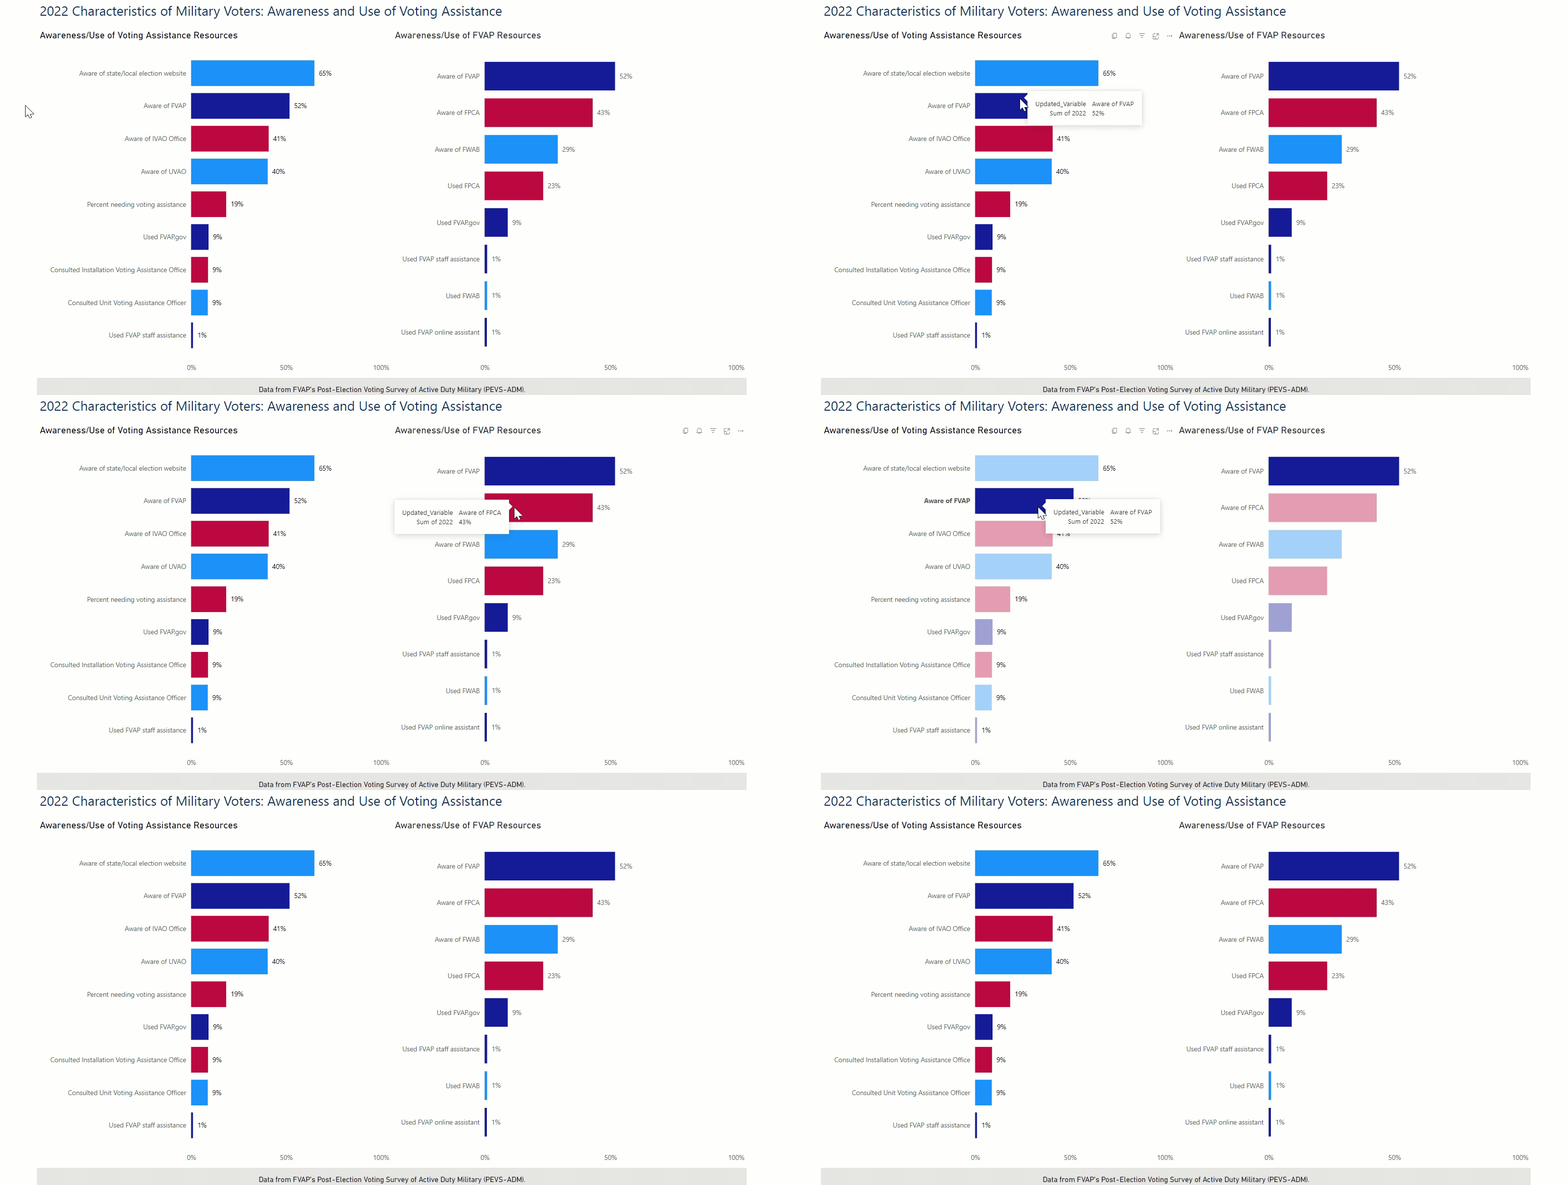
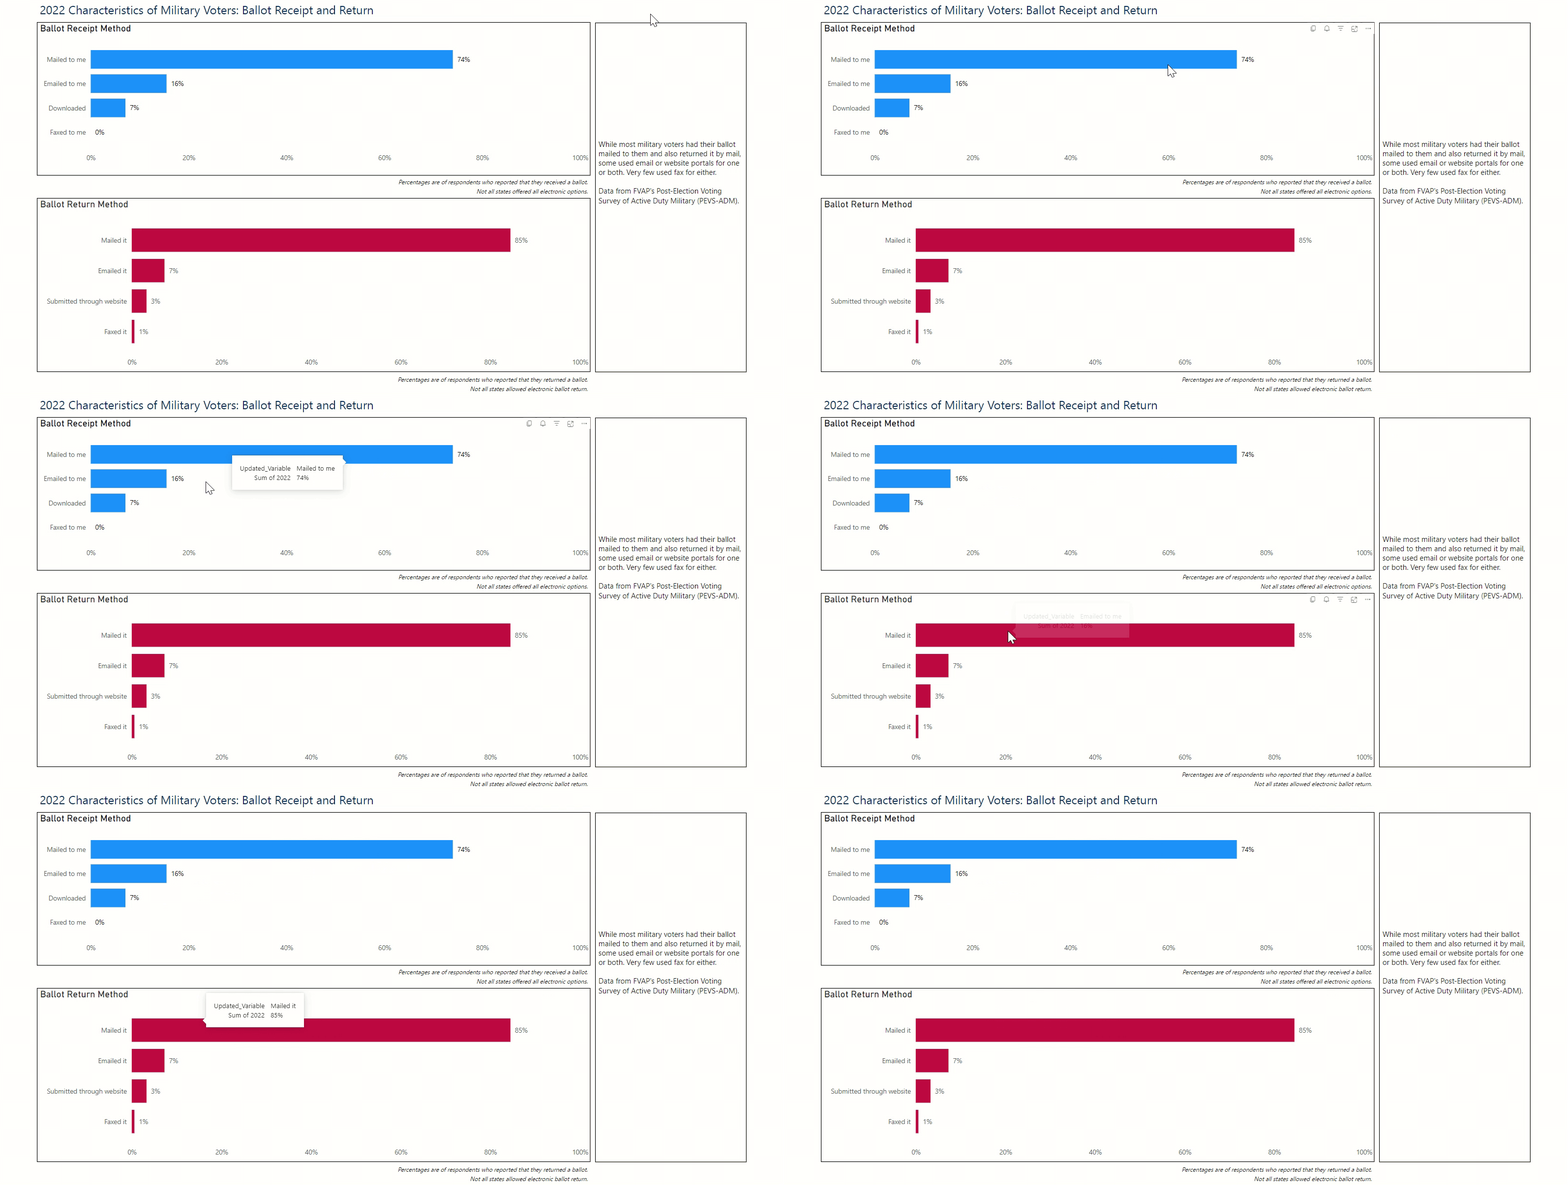
FVAP's Post-Election Survey of Active Duty Military (PEVS-ADM) reveals insights into what military voters know about voting, how they feel about it, and the steps they take.

Additional Research and Reports
State of the Military Voter provides the most current data on this important voting bloc. FVAP's annual Reports to Congress and technical reports on the biennial Post-Election Voting Survey of Active Duty Military (PEVS-ADM) also address military voting. Research Notes explore specific aspects of military voting in greater depth.


